
Risk-Free Investing?
How to Actually Chill When You VOO and Chill

I see a lot of discussion on Reddit about investing, and much of it is basically:
How do I start investing?
How do I trade and win?
Just VOO and Chill
The fact is, the stock market is incredibly complex and volatile, and your emotions can get the best of you if you don’t have a lot of experience and a proven process for trading.
That’s why people recommend “VOO and Chill”.
What the Heck is “VOO and Chill”?
VOO is basically Vanguard’s version of the S&P500. And the S&P is one of the most solid, proven indexes of the stock market (the best 500 companies). The includes a lot of companies with international footprints, which gives you some diversification, which is a VERY good idea. And it’s kind of a balanced version of the Dow (more industrial) and the Nasdaq (more tech).
So buying VOO checks a lot of boxes by itself.
(If you want more diversification, look up the Sharpes Portfolio and consider adding MMFs, Treasuries, as well as VEU for more international hedging. I may write another post about that one.)
Now, the VOO and Chill crowd is going to say to stay in VOO even during the 11% loss we experienced from Feb to April.
They say, “Don’t try to time the market.” And that’s wise, because it’s very hard to succeed at. However, there are ways to know when to buy back in, and I’ll get to that later.
If your investing window is measured in 5+ years, the simplest thing to do is just buy and hold a historically reliable index ETF like VOO.
Then you don’t have to deal with any of the math below.
(To be fair, VOO has just about recovered to the Feb 19th high over the last 63 calendar days since April 8th. And those who bought the dip, or even close to it, have seen a big value increase during that time.)
But if you’re afraid of crashes, dips, and recessions, and don’t want to allow even temporarily losses that big (maybe you think another one is coming yet this year), there’s simple way to deal with it…
PLACE “STOP LOSS” ORDERS
A stop loss (sell) order tells the trading platform (Vanguard, Fidelity, Schwab, Robinhood, etc.) to sell your stock when its price goes down too far (to a price you set).
On Vanguard, for example, you can set a price below which your shares automatically sell. If you set it in a reasonable place based on the data, this will only happen if the market is going abnormally low. Robinhood has something cooler but I’ll get to that in a minute.
So, let’s say VOO is at $553.28. If we find the Average True Range (ATR) for VOO, we can figure out its stop loss point.
What The Heck is Average True Range?
The ATR is the volatility of the stock, or how much it goes up and down during a time period.
The ATR is different in different time periods. If we include the Tariff Shock dip, it’s going to be higher - there was more volatility overall with the dip. But maybe we want to ensure we’re only staying in during the more peaceful periods of growth before and after the shock. In that case, we don’t want to include that dip, or our stop loss setting would keep us in during another dip.
In our case, the ATR was more than 2.5x higher year to date (which includes the dip) than it is right now. And it’s 6x higher than the last month’s ATR.
If you look at the prices from the highest on Feb 19 to the lowest on Apr 8, the loss was about $64, or 11%.
The ATR including the Tariff dip is roughly $7. But over the last month of growth, it’s just $1.10.
The typical recommendation for stop loss setting (except in day trading) is 3-4x the ATR. So you’d find a price $3.30 - $4.40 below the current price of $554, like say $550.
If it hit $550, VOO would have dropped below the current 50-day average price (SMA), which would be a bad sign.
The only downside of setting a stop loss is you’ll need to revise it weekly, or you could lose all your gains. Later when the price is $570, you’d still have it set for $550, and so you’d come out with a loss.
So you’d want to adjust it via the current ATR again, perhaps to $555 when it hits $560 (but check the current ATR).
But here’s an important lesson:
Your portfolio value isn’t real while you still own the stocks.
If they drop in price, so does your portfolio value.
”Don’t count your money… while you’re sitting at the table…”
To cement your gains, you have to sell some of it. In Vanguard, it’s quite simple- you sell it within an IRA and it goes into a money market fund by default (the settlement account), which earns over 4% a year right now, basically risk-free. So you can “get out of the market” (S&P500) without the money leaving your IRA or triggering a taxable event.
But this is usually less important with the most stable indexes, and unnecessary if you’re using stop losses.
What the Heck is a Trailing Stop Loss?
Here’s where some platforms - like Robinhood, Fidelity, Schwab, and others - are a bit better. (IF they actually execute your trailing stop, which I’ve seen not happen, even during normal trading hours.)
You can set a trailing stop loss which will trigger selling when the price falls a certain percentage from the latest high. Then the stop loss is based on it having hit, e.g. $570.
The ATR in the last month for VOO is about 0.20%, so our trailing stop loss should be at 0.60 - 0.80%. The only downside of doing this with such stable investments in Robinhood is that the lowest number you can enter is 1.0%. So that’s a 5x ATR, but 1% is a lot nicer than that 11% dip we experienced, which is like 10x the current ATR.
So if you set your trailing stop loss for 1% and it hits $570, then when it goes down to $565, it sells. If you had bought today at $554, you’d have $11 profit per share and you’ve avoided losses. Not only that, you made more than you would have with that $540 stop loss, if you had forgotten to raise it later on- in fact if you hadn’t raised it, you would have lost money before it sold.
This may seem complicated if you’re new to the market or hate math, but trust me, it’s a lot simpler than swing trading or (God forbid) options.
How the Heck Do You Know When To Buy Again?
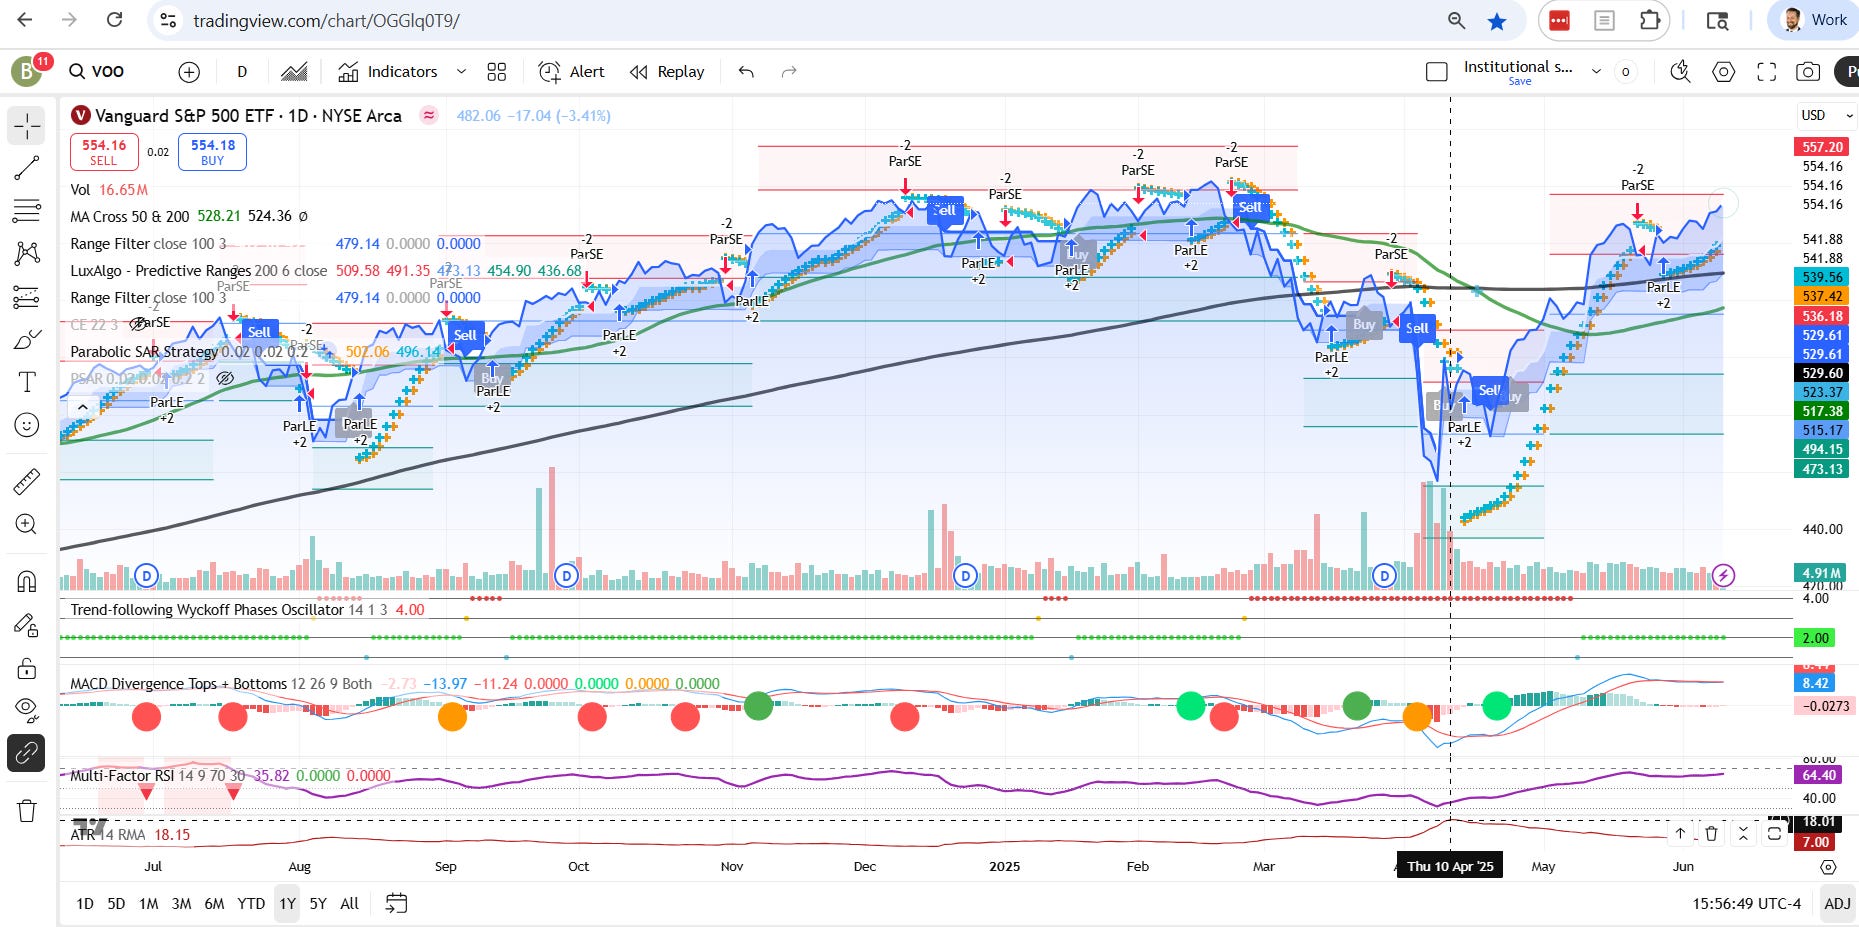
This part is super-complicated, but if you want super-reliable signals, you need to look at a long time-range (like 6-12 months) and wait for signal from a few different technical indicators. The most proven by research is a combo of MACD, RSI, and Bollinger Bands. Parabolic SAR helps as well.
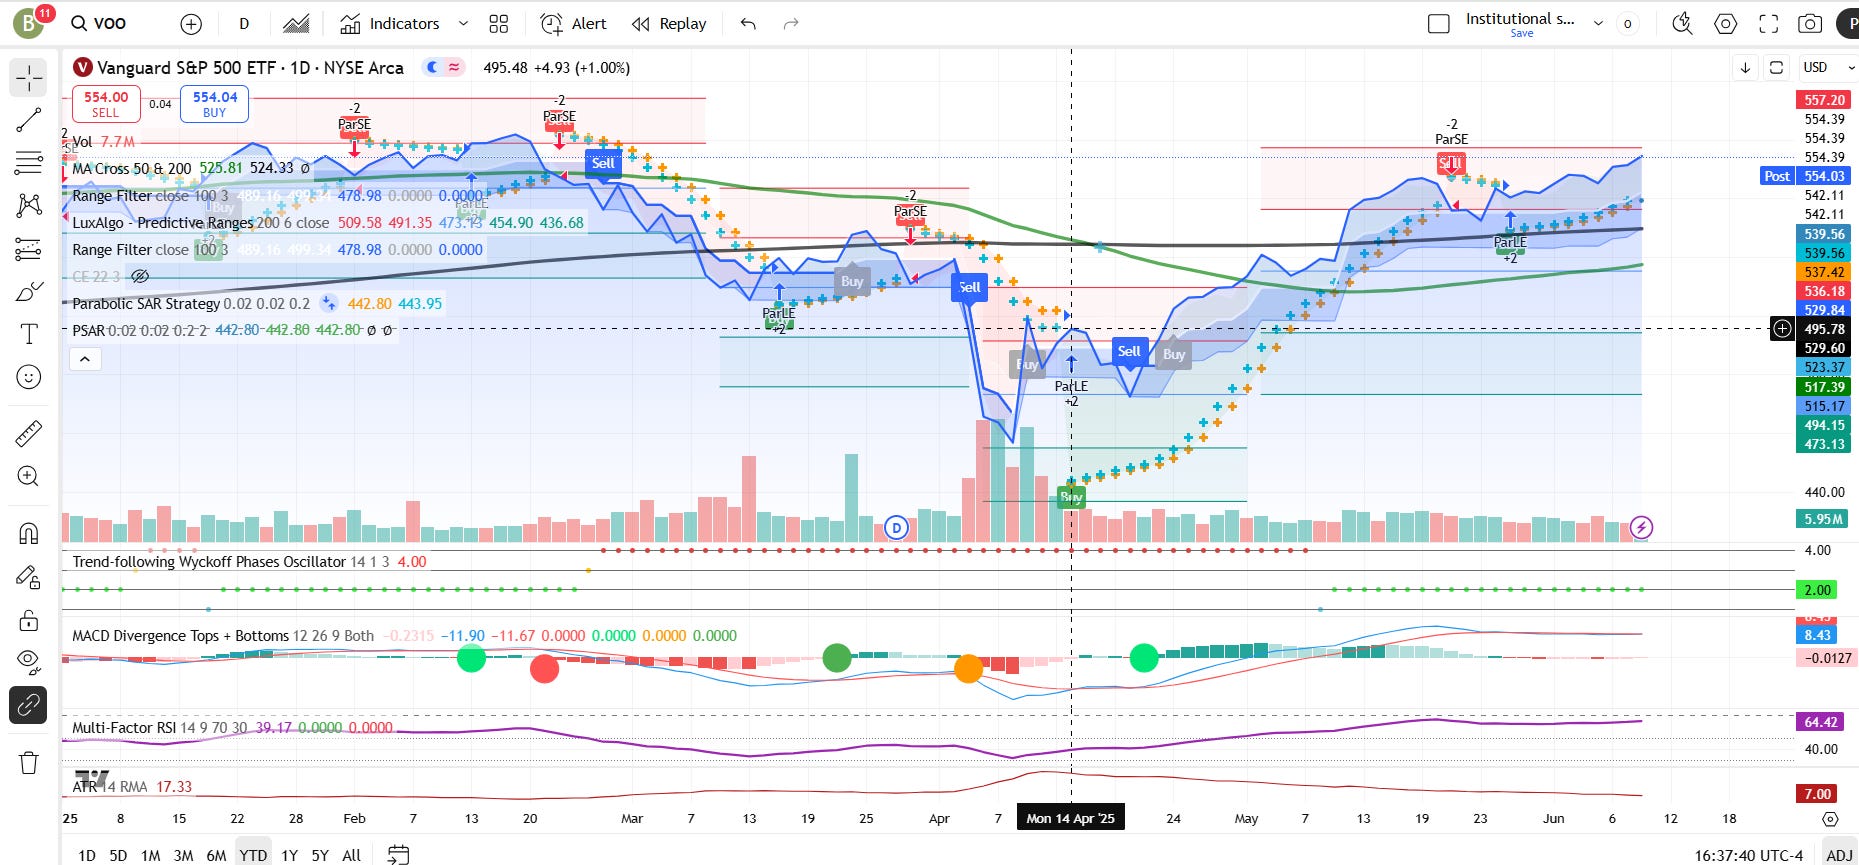
In this case, this Tradingview chart uses several SARs, a multifactor RSI, MACD Convergence, and Wyckoff phases to give you signals.
You can also see there was a late buy signal on the 9th, and a sell (at a loss) signal on the 21st. We can’t have a twitchy trigger finger.
But if you were patient and waited for several buy signal in a row, you might have come back in at that second gray buy on the 24th. Or you could have waited until it crosses the 50-day SMA on May 1st.
In the latter case, you would have sold Feb 25th at $545 and avoided further losses down to $458 (a $93 loss per share), and you would have bought back in at $514, which is $31 cheaper than when you sold. By now you’d be up another $40.
So, if you were on top of it enough, theoretically you could have stayed safe and made 8% instead of losing 11% for a while and now still being 1% down from the peak.
Experience, charting, and stop losses could have meant a gain of 8% so far rather than a loss of 1%.
But hindsight is 20/20, and emotions get in the way, so it takes a lot of experience (losing money while learning) to get competent at this. (Please don’t risk money you can’t afford to lose while learning this stuff.)
Which is why, for most of you, you should probably just VOO and Chill!
Requisite Hill Street Blues Quote: “Be careful out there.”